
So you’ve got a brilliant site built but you’re feeling like you’re still missing something? Maybe it’s not quite converting or traffic isn’t quite making it despite all the marketing efforts you’re putting in? Or are people landing on your page and then just bouncing away right away?
57% of enterprise organizations use data and analytics to drive their business strategy.
Think with Google.
Looks like you need to get to the bottom of it. That’s where Google Analytics comes in. By analyzing what’s happening with your site, you’ll know what’s working and what needs improvement in no time!
Get more acquainted with Google Analytics
If you’ve managed to make it this far through life without knowing what Google Analytics is, congrats? You’re either Ron Swanson living in the woods without technology, or you’ve managed to dodge having to do your company’s analytics work. Google Analytics, or GA, is a platform that enables the measurement and translation of a whole wealth of data coming out of users interacting with your website. Using this info, you can make informed decisions on marketing strategies and other digital efforts when it comes to your site and business.
GA is a very powerful data collection and analysis tool that can provide potentially game-changing insights. However, it can also be a little overwhelming so it’s easy for things to go wrong and you might get a little bogged down in its complexities. If you’re like many organizations out there and are basing key business decisions on the data you’re getting out of it, then the consequences of inaccurate or misleading data due to setup errors could be very dangerous.
Don’t worry, we’re here to help with this handy guide to all things analytics when it comes to your business and website.
Universal Analytics vs GA4
Universal Analytics is the current version of Google Analytics. If you set up your Google Analytics account before October 2020, you likely have Universal Analytics.
GA4 is the latest version of Google Analytics. It has a slightly different UI and the reports, tools, and features have been upgraded. If you created a Google Analytics account after October 2020, you likely have GA4.
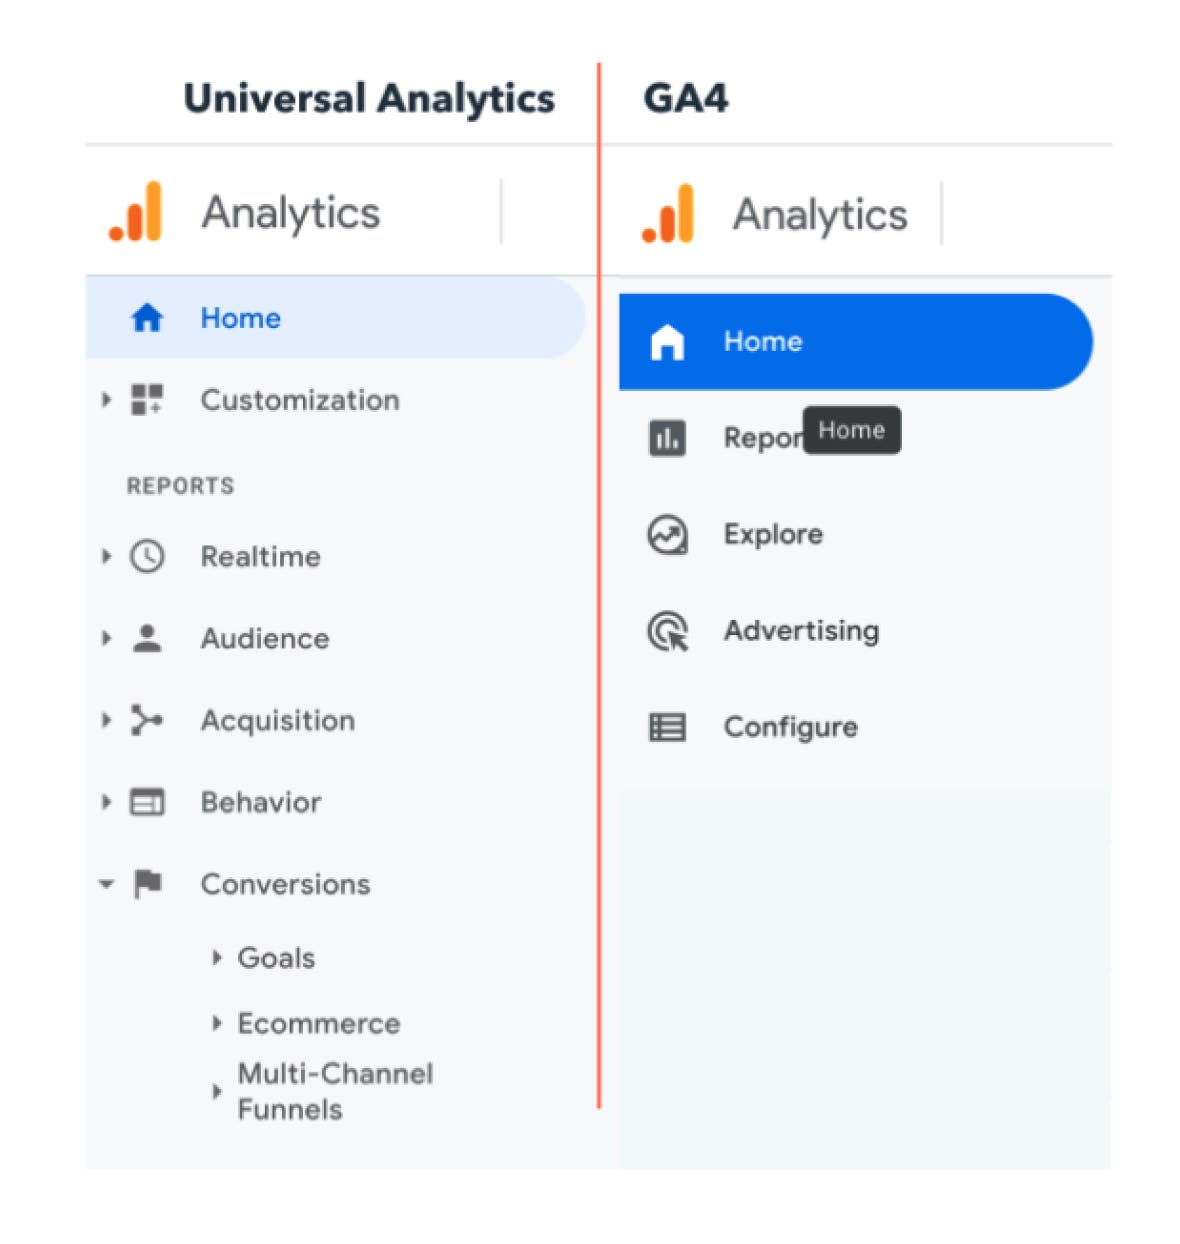
You’ll know if you have Universal Analytics or GA4 by the way your home screen looks. On the left is Universal Analytics and on the right is GA4. You’ll also know by your tracking ID number. For universal analytics, you’ll see an ID starting with “UA” (ex. UA-256835427-1). For GA4, you’ll just see a shorter number (ex. 351832185). As the property name is customizable, we like to include a GA4 indicator right in the name, just to avoid any confusion (ex. Twirling Umbrellas – GA4).
Note: Google will be sunsetting Universal Analytics in July 2023. What does that mean? It’ll no longer be used so it’ll stop processing new hits. So, if you’re going to be setting up a new account, we recommend choosing GA4. If you currently have UA, we also recommend you set up a GA4 account right away so you can start collecting data for comparison purposes.
Read more about UA being replaced by GA4 over on Google’s support forum here.
A quick guide to setting up Google Analytics
- Create a Google Analytics account or sign into your current account.
- Add the name, URL, and industry of the website you’re looking to track.
- Use the menu to Create a View, name it, select the type, and answer a few other questions
- Note: GA4 no longer uses “Views” but it instead has “Data Streams” with similar functionality.
- Add your tracking code directly after the head tag of your site.
- Visit your GA portal to verify the code is working.
Goal tracking in GA
Goal tracking is important when setting up Google Analytics because, without it, there won’t be any value in your conversion reports. They’ll either show no data, or a $0 value, which is not very helpful for you.
When it comes to your website’s health, there are four main types of goals you’ll want your user to reach:

- Destination – Reaching a specific page on your site. i.e. product or order confirmation page.
- Event – Triggers a predefined event. Ie. watching a video, or sharing something on social.
- Duration – A session on your site lasting longer than a pre-set time. I.e. 30 seconds or 2 minutes.
- Pages/Screens per session – Viewing a specific number of pages on the site or screens in an app per session.
“Gonna need those TPS Reports, ASAP”
There are five primary reports available in Google Analytics that can give you insight into your website’s performance. You’ll find these reports on the lefthand side of the screen when you’re in Google Analytics.
1. Google Analytics Real-Time Report
Insight into what’s happening on your site at this very moment. You can see how many visitors are on your site, which pages they’re visiting, which social platforms they’re coming from, where they’re located, and more.
Ways to use this report:
- See how much traffic you’re getting from a new social or blog post
- Know immediately if a one-day sale or event is driving views and/or conversions
- Make sure tracking URLs and custom events that you’ve just set up are working as they should
2. Google Analytics Audience Report
A high-level overview for the property you’re currently looking at. Check this report once a day to get a sense of how you’re trending overall.
Ways to use these reports:
- Look at 1-day, one week, two week, and four week active users to determine retention
- Calculate Customer Lifetime Value (CLV) of your audiences (eg. email vs organic searches)
- Group users by one characteristic to learn more about certain cohorts
3. Google Analytics Acquisition Reports
Breaks down your traffic by source: organic, direct, referral, email, social, paid search, display, affiliate, and (Other). Depending on the category, you’ll see which URLs your visitors entered the site, which website brought them to you, or what query got them to you.
Ways to use these reports:
- Get more granular insight into the ways people are coming to your site
4. Google Analytics Behavior Reports
This is the most useful set of reports.
Site content – gets you a review of all of the blog posts, landing pages, web pages on your site.
All pages – shows the top-trafficked pages for your current view and/or segment.
Content drilldown – breaks down the structure of your site by subdomain and then subfolder and attached data.
Landing pages – breaks down a visitor’s first interaction with your site
Exit pages – last pages users visited in their sessions before they left your site
Site speed – how quickly your site is loading for users
Site speed page timings – average page load times for each URL
Site search – how frequently people used site search, what people are searching for, and which pages users are starting searches from
Events – user interactions with content that can be measured independently from a web page or a screen load. Ie. watching a video or downloading a file
Ways to use these reports:
- Looking at the overall health of your site with site page timings and speed
- Get a better idea of the path your users are taking in and out of your site
- How people are finding your site with searches
- Clock how user interactions with campaigns or extra efforts are working – ie, building a PDF to be downloaded by people
5. Google Analytics Conversion Reports
It’s important to have objectives for the people coming to your site. These reports track the goals you’re trying to achieve, such as email subscribers, sales, page views, etc. They’ll also be able to tell you where these goals were achieved, and where you’re seeing dropoff in the conversion funnel.
Ways to use these reports:
- Learning what your users are buying/subscribing to the most
- Be able to identify low achieving features on your website that can be enhanced
- Find where customers are dropping off in your funnel
GA4 Tools
Similar to universal analytics, GA4 gives you plenty of useful reporting, but there are some differences to keep an eye on.

1. Home
This is a dashboard where you can customize your view to see reports, stats, and other figures. This is a good place to see a snapshot of the overall performance of your site.
2. Reports
Open this to find a similar snapshot of your analytics. Or, switch your view to see Reports Snapshot, Realtime, Life Cycle, and User.
3. Explore
This is where you can look into the ways visitors navigate your site to find new pages and content. Choose from the presets or create a custom one from scratch.
4. Advertising
This is where you’ll find the channels and touchpoints that drive the most conversions on your site. Ie. social, direct, email, etc.
5. Configure
This is where you’ll set up the key pieces of your reports, from audiences to events, conversions, and other custom definitions.
Easy as 1, 2… 5.
Fortune favours the planners. Follow these steps, and we can almost guarantee smooth sailing when it comes to your analytics.
Determine Your Primary Business Goals
Like Ryan Gosling said so many years ago, “What do you want?!” Making sure you determine your primary business goals before you start mucking about in Google Analytics is definitely the way to set yourself up for success. Otherwise, you’re going to have some frustrations down the line. This is where you can be lofty and general.
Decide your KPIs
Once you have your primary business goals in place, it should be fairly easy to decide on KPIs that will lead to them. These should be more specific, such as # of visitors a month, or a certain percentage increase in traffic over X amount of time.
Plug-in to get the most out of your platforms
Make sure all your marketing platforms (social, email, etc.) are plugged into your analytics with UTM tracking, etc. If they’re not, you won’t get the full snapshot of what you’re doing on the marketing front, and your reports may be skewed or confusing.
Figure out your segments.
A huge amount of data is running through Google Analytics regularly. In order to not feel like you’re just drinking from a firehose, segmentation is your friend. Creating audiences and cross-sections of your users allows you to gather usable insights to act on.
Check and adjust on the regular.
This is not a set-it-and-forget-it kind of thing. Keeping an eye on your analytics can help you increase conversions, and keep your website healthy and up-to-date. Make sure you schedule reports to ensure you’re doing a regular check-in on your site.
Getting more analytical than a Billy Crystal movie
In addition to Google Analytics, we use a few more apps and platforms to better understand and track both your and your competitors’ efforts and effectiveness.
Agency Analytics
It’s easy to get lost in Google Analytics, especially when you’re not using it regularly. We use a reporting software called Agency Analytics to create custom reports that pull data directly from Google Analytics. Using this software, we can work together to determine which metrics are important to your business, and send you monthly custom reports highlighting what you’re focusing on. We’ll also set up with a custom dashboard that you can log into whenever’s convenient, so you can see the data you’re most interested in, in real-time.
SEMRush
A keyword and competitor research tool, similar to Ahrefs and Moz Pro. It allows us to dive deeper into your current organic and paid traffic, backlinks, competitors, keywords and position in search, site audits, and more. This is a great platform to help grow traffic and optimize your website.
Hotjar
A user-centric heat-mapping and session recording tool, to help visualize customer journeys and highlight where users are getting stuck. While we can’t watch over the shoulder of every user interacting with your website, HotJar comes pretty close! Knowing what your users are doing and identifying their pain points is a great way to gather data and improve user experience.
Hubspot
A powerful CRM platform that connects the sales, marketing, content management and customer service aspects of your business. You can integrate your Google Analytics account with HubSpot to draw on your analytics data and put it to use in your marketing funnel. HubSpot has integrations for just about everything and can even be used to manage your social media, your contact forms, landing pages and more.
Google Trends
A free tool (powered by Google) that analyzes the popularity of top search queries in Google Search. This tool is great for making comparisons between two searches to see which is more popular and to see how search interest has changed over time.
Google Search Console
Also powered by Google, this free platform helps you monitor your site’s presence in Google Search results and provides opportunities for improvements in site speed (along with Google’s PageSpeed Insights tool), mobile friendliness and core web vitals. It also provides insights into your website links and has tools for submitting new sitemaps and update requests.
It’s all about performance.
We touched on it briefly in the reporting, but there are ways to look at the performance of your website. Things such as site loading speed and mobile score can answer the question of why people are bouncing from your pages so fast after clicking through on an ad or email. They can even tell you why your products aren’t converting as well as they should be. We use mobile speed scores in Google’s Search Console.
Throw $h!t at the wall and hope something sticks.
That’s a lot of people on mobile. If your site isn’t mobile-friendly, you will see a huge drop-off in traffic, conversions, and a big uptick in people bouncing off your site. Make sure you check in on your mobile score after updates and additions of pages.
Don’t snooze or lose.
What we’re really saying is don’t sleep on analytics when it comes to your website. If you’re not keeping an eye on your site’s health, and what’s working and what’s not, then there’s not really any point in putting effort into said site. It’s like you’re just throwing spaghetti.