
Are you using your association’s data to its full potential?
Your members, their interactions, your programs, your events – it all generates data that can be used to drive the decisions your association makes. If you’re relying solely on instinct or gut feelings of what you think your members are doing on your site, and what they’re looking for, you might be missing out on valuable insights.
That’s where data and analytics step in, offering a clear lens to understanding your members better, fine-tuning your offerings, and ultimately, steering your organization towards success. It’s not about becoming a team of statisticians, it’s about unlocking the valuable insights already hidden within your everyday operations.
In this article, we’ll be exploring the ways in which data can create a better experience for not only your members, but also clarity for your staff and partners. We’ll give you a look into the analytics you should be keeping an eye on, the different ways to track your members’ data, as well as some considerations when it comes to analytics and tracking.
Using data to create a better experience.
Data is more available than ever and more important than ever for associations. You can start to use it to really understand your audience – what they want and need.
By taking a deeper dive into how your members are using and behaving on your site, you can see what’s working and what isn’t. This helps in measuring engagement and the overall impact of your initiatives to make sure you’re on the right track with your efforts.
Data also gives you the insights you need to enhance your member acquisition and retention strategies, ensuring you’re attracting and talking to the right people, as well as keeping them engaged and happy. And it’s always key to keep an eye on your marketing ROI to make sure you’re on the right track with what you’re doing.
Ultimately, this data-driven approach is what will guide your strategic decisions, providing clarity for your staff and revealing patterns that might otherwise be missed if people are just working off their gut feelings or what they think your members are doing.
Analytics to keep an eye on – the Four Ws.

To really understand how your site is being used and, more importantly, how to elevate and improve it, there are a few data points and analytics to monitor. Knowing how your users move through your site, what they interact with, and also what they’re getting stuck on, can help you provide the best possible member experience.
Who’s coming to your site?
Understanding your audience is crucial.
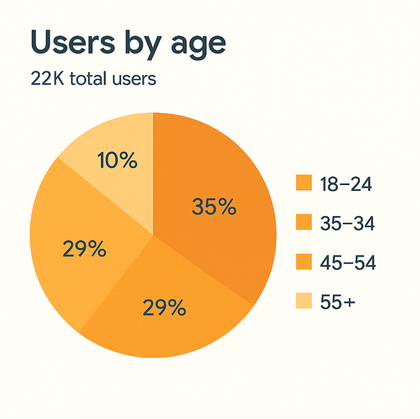
Demographics
Knowing data points of your visitors, such as age, gender, education, etc., helps you to tailor content, messaging, and member benefits to their specific needs and interests. This leads to increased relevance, engagement, and ultimately, higher member satisfaction and retention. For example, if a large portion of your audience is early-career professionals, you might offer mentorship programs or networking events geared towards them.
Geographic location
Where are your visitors coming from? Understanding this helps you to optimize your site for regional differences such as language, plan targeted marketing campaigns for specific geographic areas, identify opportunities for local chapters or events, and understand the full reach of your association.
Referring sources
This data shows you which channels are most effective in driving traffic to your site. This allows you to allocate your marketing budget more efficiently, identify successful partnerships or collaborations, refine your SEO strategy to improve organic search rankings, and measure the ROI of social media campaigns, email marketing, and other promotional activities.
Devices used to access your site
This data ensures your website’s optimized for all devices, from desktop to mobile, and is crucial for providing a positive user experience. You can prioritize mobile-friendly design and development, identify any device-specific issues or usability problems, and improve accessibility for all users.
What are they doing when they get there?
This reveals what content is most valuable.
Most visited pages
These pages represent the core interests and needs of your audience. By knowing which pages are most popular, you can ensure that this content is high-quality, up-to-date, and easily accessible. You can also identify opportunities to promote relevant products, services, or events on these pages, and understand what information your current and potential members find most valuable.
Time spent on specific pages
This metric indicates the level of engagement with your content and can help you improve your content strategy and optimize the user experience. High time spent suggests that the content is valuable and engaging. Low time spent may indicate that the content is irrelevant, poorly written, or difficult to understand.
Popular downloads
Downloads, such as white papers or reports can give you an idea of what makes for a deeper level of engagement and interest. By tracking downloads, you can identify what resources attract and retain members, measure the effectiveness of your content marketing efforts, and generate leads and track conversions.
Search terms used on your site
What are visitors looking for? This data point can highlight gaps in your content or navigation. By analyzing search terms, you can also improve your site’s search functionality and navigation, optimize your content for relevant keywords, and understand the specific needs and interests of your audience.
Engagement with specific content formats
Are visitors more engaged with videos, blog posts, infographics, or other formats? By figuring that out, you’ll be able to optimize your content creation strategy, make sure you’re delivering information in the most effective and engaging way, and allocate your resources efficiently to produce the most impactful content for your members.
Where are they engaging with your site?
This focuses on member engagement and key conversions.
Bounce rate on key member pages
A high bounce rate on key pages such as membership renewal or event registration, means you’ve got a big problem. It could be one of three things: the page is not relevant to the visitor’s needs, it’s poorly designed or difficult to use, or you’ve confused them with your CTAs. Addressing these issues can significantly improve conversion rates.
Time spent on site per visit
This one’s pretty straightforward. A longer time spent on site generally suggests higher engagement and interest. A shorter time spent could mean your visitors aren’t finding what they need or are having difficulty navigating the site.
Number of pages visited per session
How deeply are visitors exploring your site? Similar to time spent, a higher number of pages visited per session suggests that visitors are exploring your site and finding valuable content. If they’re dropping into one page and bouncing away, it’s time to look into why and figure out a solution.
Completion rate of event registrations, membership renewals
How effectively are you driving desired actions to achieve your key goals? By tracking completion rates, you’ll be able to identify and remove friction points in the registration or renewal process, optimize the user experience to maximize conversions, and measure the success of your online initiatives.
Member-only section interactions
For associations, the member-only section is a crucial part of your value proposition. Tracking usage of these resources helps you to measure the value of your member benefits, figure out which resources are most popular and which ones may need improvement, and most importantly, inform your decisions about future member offerings.
Why are you losing them?
Identifying pain points is essential for improvement.
High bounce rate on specific pages
Seeing this data point indicates confusing or irrelevant content. If people are bouncing away from your key pages, you should probably look at the user journeys or content to make sure you’re giving them the experience and the content they’re looking for.
Low engagement with important CTAs
Are your calls to action clear and compelling? Low engagement with CTAs means that you’re not effectively guiding visitors towards desired outcomes. Keeping an eye on this analytic gives you feedback to help you optimize the placement, design, and wording of your CTAs and improve conversion rates for key actions.
Difficult or confusing user journeys
Using tools like Hotjar, you’ll be able to see recordings of real user interactions with your site – where they’re clicking, where they’re spending most of their time. This will help you figure out your users’ pain points in the user journey and adjust accordingly so visitors can find the information they need. This hopefully leads to improved overall user satisfaction.
Broken links or error pages
Broken links and error pages make for a negative user experience and can damage your association’s credibility. They also disrupt the user flow and prevent visitors from accessing important content and will negatively impact your website’s search engine rankings. Regularly checking for and fixing these issues is essential for maintaining a high-quality website.
These four Ws lead you to the How – how are you going to use this info to create a more engaging, valuable, and optimized experience for your members?
How to track and collect your member data.
There are other ways to get even more data from your members. You can use tools like Google Analytics to get invaluable insights into user journeys and interactions across different devices, revealing how members navigate your online presence. While platforms like MemberPress provide specific reports on membership sign-ups and payments, integrating your website with a CRM tool such as HubSpot can pull in data from various points to get you a full view of member interactions.
You can go directly to the source with feedback through embedded surveys, polls, and contact forms strategically placed on relevant pages. As well, email marketing platforms like Mailchimp can give you another layer of data – from list growth to open rates, and engagement with your email content.
Data collection considerations.
When deciding to collect data about and from your members, you have to take into account some of the considerations and challenges too, not just what data you want.
The first, and most common, is a lack of resources. Budget limitations can restrict the ability to invest in sophisticated analytics tools, and staff time and a lack of specialized knowledge can hinder effective data collection and analysis. Data silos and integration challenges often prevent a holistic view of member data, as information may be scattered across disparate systems that don’t communicate with each other. This makes it difficult to identify trends and gain actionable insights.
Finally, privacy and security concerns are paramount. Associations have to comply with evolving data protection regulations and ensure they’re handling member data ethically and responsibly to maintain trust and avoid potential legal repercussions.
Where do you start?
Now that you’ve figured out what analytics you’re going to keep track of, there are a few next steps that will help you stay focused and be set up for success.
- Start small and focus on a few key areas you want to understand and act on. Don’t worry about everything or you may get overwhelmed.
- Identify how and where you’re collecting your data. If you’re adding GA4 tracking tags, for example, make sure it’s done correctly and not more than once. Otherwise, you’ll skew your data. This is an issue we’ve seen a lot when onboarding new clients and their sites.
- Invest in analytic tools and training. Or, alternatively, hire an agency like us to take care of your WebOps for you.
- Review, review, review. Make sure you’re reviewing regularly to ensure you’re always evolving and adapting according to your organization’s goals.
A deeper connection to your members.
Ultimately, embracing data and analytics isn’t just about crunching numbers and having data for data’s sake. It’s about fostering a deeper understanding of your association’s ecosystem and how your members move through your digital spaces. It empowers you to connect with your members on a more meaningful level, deliver more impactful programs, and make strategic decisions grounded in evidence. Time to step away from using your assumptions that may or may not be putting you on the right track.
The ability to harness the power of your data is no longer a competitive advantage – it’s a way to ensure a sustainable and thriving future for your association. By making data-informed decisions a core part of your operations, you unlock your organization’s full potential for years to come.